3.6.37 Terpenic By – Product Of Deterpenation of Essential Oils – Price Values and Quantity by year from 2000 to 2007
3.6.37.1 Overview
| Scientific name: | N/A |
| Common name: | Terpenic by-product |
| Plant part used: | fruit by deterpenation of essential oils such as citrus oils |
| HS Code: | 330190100 |
| SITC Code: | 551350100 |
3.6.37.2 Analysis
Terpenic by-product from essential oils have many applications especially in the chemical industry. Data for quantities exported were available only for five (5) years while the other years, namely for 2000, 2004 and 2005, the figures were not declared. The range of the quantities exported was from as low as 10 kg to the highest at 9,755 kg. Generally, the profile for the quantities exported indicated a decreasing trend while revenues collected from export of the product also followed the same pattern, but picked up again in year 2007. From the table, the product unit costs were inconsistent ranging from RM21.68 to RM700.
Most of the materials were exported while in years 2000 and 2004 they were consumed locally as shown by negative values of the differences between export-import unit costs of the product.
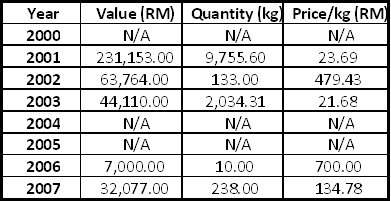
Table 135: Summary of value and volume export
*Note: N/A refers to undeclared value by The Royal Customs and Excise
Department of The Government of Malaysia
The export of Terpenic by-product indicated great differences in prices and this could be attributed to the difficulties in getting high-quality products during its processing. Many stages of processing were involved and the end-results culminated into different qualities of raw materials. High grade commodity would fetch high prices and thereby resulting in greater values as in years 2002 and 2006.
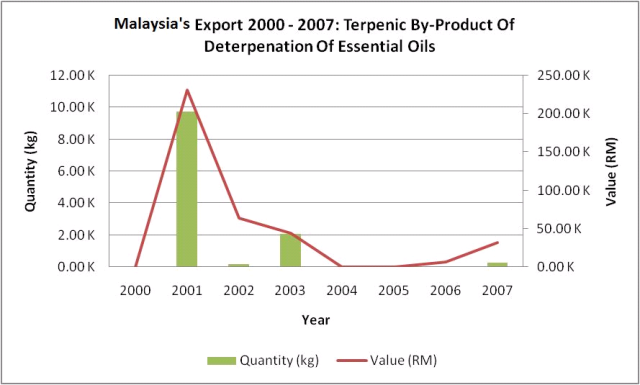
Figure 185: Malaysia’s export 2000 – 2007 for Terpenic By-Product Of Deterpenation Of Essential Oils
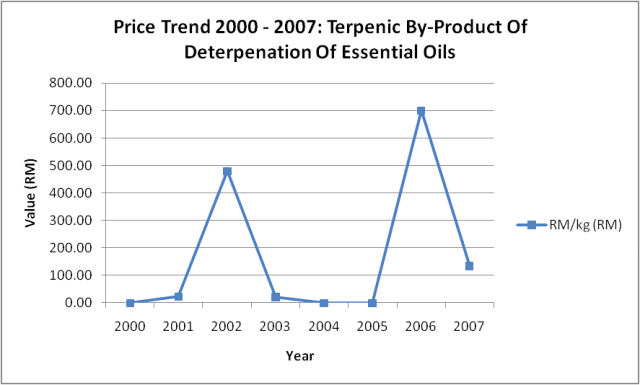
Figure 186: Exported Terpenic By-Product of Deterpenation of Essential Oils price trend 2000 – 2007
| Year | Export(RM) | Import(RM) | Diff(RM) |
| 2000 | N/A | 6.58 | -6.58 |
| 2001 | 23.69 | 6.61 | 17.08 |
| 2002 | 479.43 | 9.78 | 469.65 |
| 2003 | 21.68 | 10.04 | 11.64 |
| 2004 | N/A | 7.12 | -7.12 |
| 2005 | N/A | 7.24 | 7.24 |
| 2006 | 700 | 9.31 | 690.69 |
| 2007 | 134.78 | 10.03 | 124.75 |
Table 136: Export and Import Unit Cost Differences of Herbal Products : 2000 -2007
*Note: N/A refers to undeclared value by The Royal Customs and Excise
Department of The Government of Malaysia