2.3.52 Concentrates of Essential Oils in Fats, in Fixed Oils, in Waxes or The Like, Obtained by Enfleurage or Maceration – Price Values by Year from 2000 to 2007
2.3.52.1 Product Specifications
| Scientific name: | N/A |
| Common name: | Fixed oil |
| Plant part used: | Fruits, plants |
| HS Code: | 330190200 |
| SITC Code: | 551320200 |
2.3.52.2 Analysis
Imports of concentrates of essential oils in fats, fixed oil in waxes and the like were relatively small but their total values were high. Less than 14,000 kg of products were brought into the country each year. Their quantity for each year is not constant but they are more inclined to settle at low amounts. The total values of purchases indicated vast differences between the years and exhibit fluctuating values during the period. The cost per kg of product was moderate and ranged from RM29.18 to RM344.79.
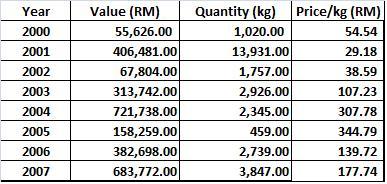
Table 55: Summary of import values and quantities
The great differences in price per kg of raw materials as shown above resulted from problems inherent in commodity trading. The market demand and prices for essential oil production could be attributed to global crop growing conditions, the amount of stored products from the past and the changing market demand driven by consumer preference and by manufacturing formulators. Large fluctuations in price can result in uneconomic production of crops.
Another reason for big differences in prices of the commodity during the observed period could be due to the requirement of the importing countries requiring high standard quality products. . Market demands for the products would require that no adulterated or contaminated commodity is to be brought into the country.
Since concentrates of essential oils and similar products belonged to a small market segment of the herbal raw materials supply, the prices of these commodities would fall by the increased in quantity produced.
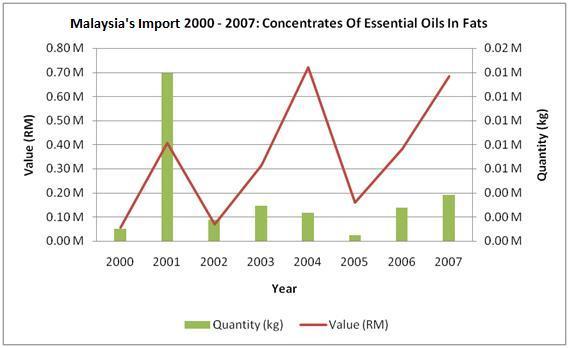
Figure 104: Malaysia’s import 2000 – 2007 for Concentrates of Essential Oils
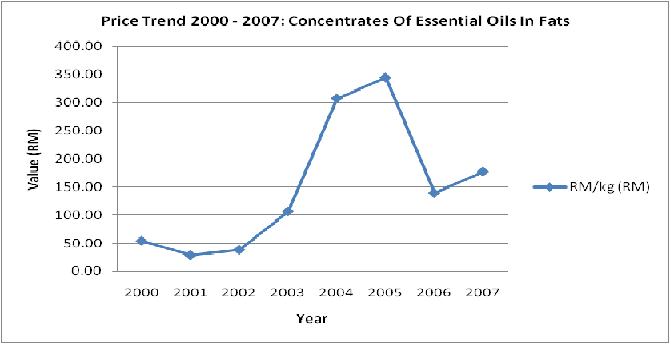
Figure 105: Imported Concentrates of Essential Oils price trend 2000 – 2007