3.6.31 Essential Oils of Citrus Fruit – Price Values and Quantity by year from 2000 to 2007
3.6.31.1 Overview
| Scientific name: | Citrus latifolia Tanaka |
| Common name: | Limao taiti |
| Plant part used: | Fruit, distilled |
| HS Code: | 330119000 |
| SITC Code; | 551319000 |
3.6.31.2 Analysis
Essential oils of citrus fruits were usually traded in moderate amounts asillustrated in the accompanying tables and graphs, the exported quantities had irregular profile. Generally the amounts decreased from year to year. The maximum amount exported stood at 48,247 kg while the minimum quantity was at 713.56 kg. The revenues obtained from the export of the product followed the same pattern and ranged from RM29,985 to about RM385,097. The sudden surge in quantity exported in year 2003, but decreased in the following year, indicated that demand for the product was seasonal. The amount exported and total revenue collected did not compliment each other. In year 2003 as indicated in the table although the cost per kg of the product was at the minimum, and the amount exported was at the maximum, the export revenue earned in the year was less than that in year 2001. This indicated that low price did not produce maximum product quantity as expected as shown in data registered for year 2003. The unit cost profile indicated irregularity and unit cost of the product ranged from RM7.92 to RM55.65.
Differences in export and import values had positive figures for the years under consideration except the for year 2003 which was in the negative. Profits were the driving force for export of the product. In 2003 however, the local consumption was outstripping the amount for export.
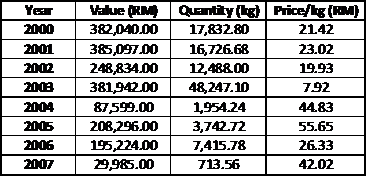
Table 123: Summary of value and volume export
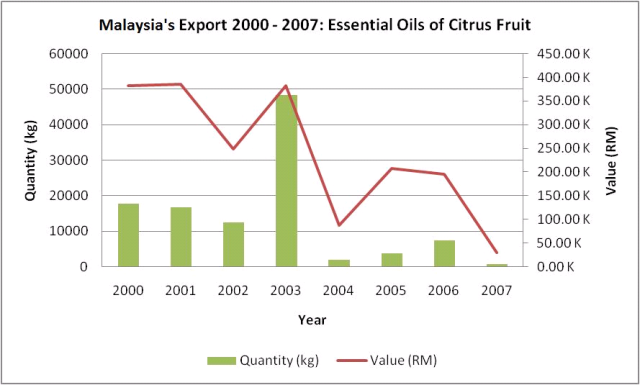
Figure 173: Malaysia’s export 2000 – 2007 for Essential Oils of Citrus Fruit
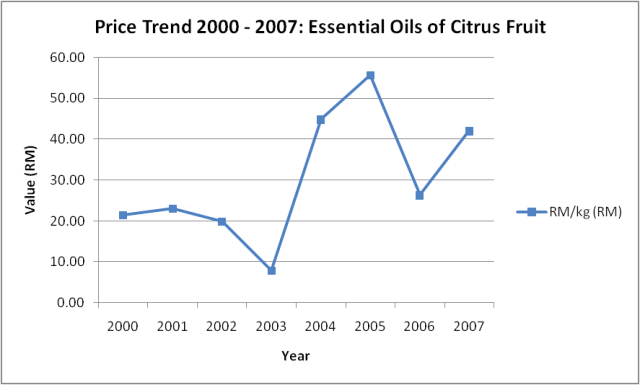
Figure 174: Exported Essential Oils of Citrus Fruit price trend 2000 – 2007
| Export(RM) | Import(RM) | Diff(RM) |
| 21.42 | 17.67 | 3.75 |
| 23.02 | 13.60 | 9.42 |
| 19.93 | 15.14 | 4.79 |
| 7.92 | 14.74 | -6.82 |
| 44.83 | 17.01 | 27.82 |
| 55.65 | 29.24 | 26.41 |
| 26.33 | 17.40 | 8.93 |
| 42.02 | 36.89 | 5.13 |
Table 124: Export and Import Unit Cost Differences of Herbal Products : 2000 -2007