3.6.19 Gaharu Wood Chip – Price Values and Quantity by Year from 2000 to 2007
3.6.19.1 Overview
| Scientific name: | Aquilaria agollocha (Roxburgh) |
| Plant part used: | Resinous stem, heartwood, bark |
| HS Code: | 121190200 |
| SITC Code: | 292490200 |
3.6.19.2 Analysis
Gaharu wood chips can be extracted for fragrances. Raw materials were readily traded to many countries especially to the Middle East. They were exported in moderate amounts from as low as 429 kg to about 1.184 million kg. As shown in the accompanying graph, the initial quantities of the product exported was very high but dropped thereafter from year to year. Such situation could have been due to the low price per kg of the product in the early years but was higher as the years progressed. The availability of alternative products such as sweet smelling flowering plant also could have also influenced the demand. The revenues obtained from the export showed a gradual increase in the early years and significant increased in the later years. The costs per kg of the product at showed low values in the initial years and in year 2005 and 2006, there were increases in the prices but dropped again in year 2007.
As for differences in unit costs per kg of export-import values, the first 5 years had negative figures, and in the later years, the export of the product gained higher profits as shown by the positive values.
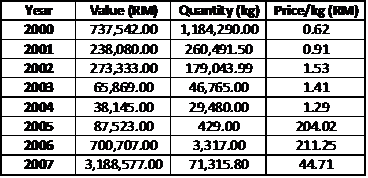
Table 99: Summary of export volumes and values
There were large differences in prices of Gaharu products during the observed period. As in other products with large differences, the causes might have been due to product quality and under-supply of the commodity in the global market.
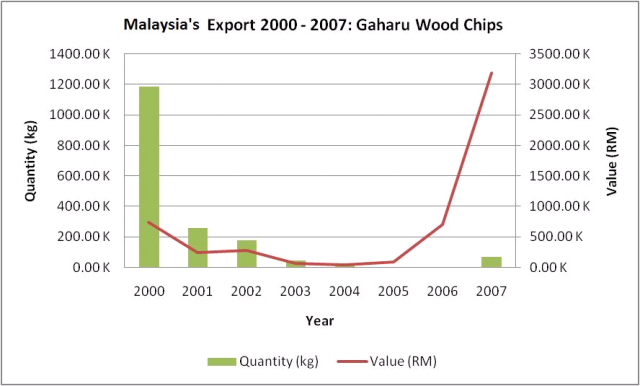
Figure 149: Malaysia’s export 2000 – 2007 for Gaharu Wood Chips
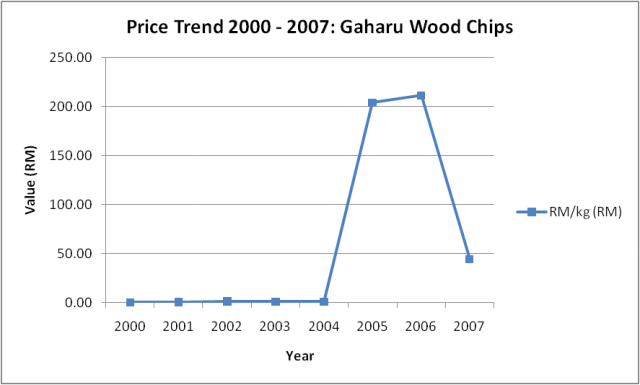
Figure 150: Gaharu Wood Chips price trend 2000 – 2007
| Year | Export (RM) | Import(RM) | Diff(RM) |
| 2000 | 0.62 | 0.92 | -0.3 |
| 2001 | 0.91 | 1.76 | -0.85 |
| 2002 | 1.53 | 4.41 | -2.88 |
| 2003 | 1.41 | 2.00 | -0.59 |
| 2004 | 1.29 | 13.41 | -12.12 |
| 2005 | 204.02 | 46.15 | 157.87 |
| 2006 | 211.25 | 30.65 | 180.6 |
| 2007 | 44.71 | N/A | 44.71 |
Table 100: Export and Import Unit Cost Differences of Herbal Products : 2000 -2007
*Note: N/A refers to undeclared value by The Royal Customs and Excise
Department of The Government of Malaysia