Of the 38 HS Codes analyzed in Tables 2.1 and 2.2, in terms of values reported, Malaysia is a net importer of about 80% of the categories of natural ingredients. In 2005, Malaysia had 30 HS Codes showing a negative net trade in value and in 2006, 31 HS Codes showed a negative net trade in value. Even though most items show a negative net trade, Malaysia’s overall net trade for this grouping of natural ingredients is positive. The reason for this is the fact that, of the few positive net trade items, Malaysia is among the leading global exporters and therefore the quantities and values for these items are significant. The very large export values of just a few top items offsets the generally negative trade value for most natural ingredients.
Most of the natural ingredient categories that show a positive net trade value also show a significant percentage share of total world exports. For example, Malaysia’s percentage share of world exports for cinchona alkaloids in 2005 was 16.9%, cocoa butter 11.9% share, curry powder 11.4% share, black pepper fruit 8.7% share, coconut oil 8.44% share (although coconut oil showed negative net trade), and other spices NESOI with a 2.2% share of global exports.
Therefore, this section will mainly take a closer look at those Malaysian natural ingredients that command at least a 1.0% share of total world exports and also represent a positive net trade in value for Malaysia. Some other selected natural ingredients with less than a 1.0% share of total world exports will also be discussed briefly at the end of this section along with some ingredients for which specific trade data are unavailable. Some of future prospects for increasing Malaysian exports of natural ingredients may be found somewhere within the currently lower volume items that could be targeted for development. Table 2.3 lists the natural ingredients that will be discussed in more detail in this chapter.
Table 2.3 Malaysian Natural Ingredients with at least 1.0% Share of World Exports and also a generally positive net trade in value .Value in USD (1 USD = 3.4525 MYR), (%) Share of World Exports
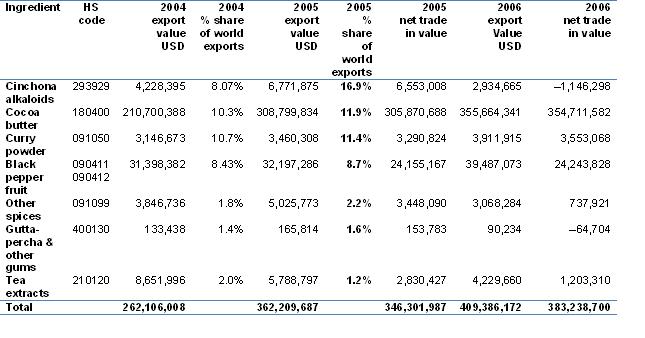
For the 38 HS Codes analyzed in Tables 2.1 and 2.2, respectively, the 7 natural ingredients listed in Table 2.3 represented 66.5% of Malaysian total export value for 2004 and 71.2% of export value for 2005, respectively. These items certainly appear to represent the most important Malaysian natural ingredient exports in terms of reported value as well as in terms of percentage share of world exports.
Cinchona alkaloids
Cinchona alkaloids are obtained from various species of Cinchona and their hybrids or Remijia pedunculata Flückiger (Fam. Rubiaceae). The pharmaceutical drug products that are produced from these include quinidine gluconate (gluconate of the alkaloid), quinidine sulfate (sulfate of the alkaloid), and quinine sulfate (sulfate of the alkaloid). Malaysia had an approximate 8.1% share of world exports in 2004 and a 16.9% share of world exports in 2005. The MATRADE data for 2006 shows that Malaysia exported 3,647,186 kg valued at MYR 10,131,932 (=USD $2,934,665) and in 2005, exported 9,180,102 kg valued at MYR 23,379,900 (=USD $6,771,875). In this case, the COMTRADE database reported significantly different numbers showing 2006 Malaysian exports of 1,823,593 kg valued at $1,382,055 and 2005 exports of 4,590,051 kg valued at $3,087,473. In terms of volume, Malaysia is the world’s leading exporter but in terms of reported values, European exporters (and re-exporters) are ahead of Malaysia including Austria, Germany, Ireland, and Switzerland.
In terms of volume, in 2006, most of Malaysia’s cinchona alkaloids were exported to the Netherlands with smaller amounts to Japan, Germany, Thailand, and the UK. In 2005, most of the export volume went to Germany, followed by the Netherlands and the USA, among others.
The EU-25 Member States, in 2005, imported an undefined quantity with a reported trade value of $2,643,652, mainly from Indonesia and Switzerland (not a member of the EU-25), as well as smaller amounts from India, China, the USA, and Romania, among others.
The USA, in 2006, imported a total of 30,484 kg of cinchona alkaloids with a reported trade value of $3,894,162 and in 2005 the USA imported 33,062 kg with a reported trade value of $3,721,074. USA imports were mainly from Germany and Indonesia. An inconsistency in the COMTRADE database is that Malaysia shows an export quantity in 2005 to the USA of 300,051 kg valued at $443,529, however the USA shows no record of any imports from Malaysia in 2005.
Over the past five years, the average reported value of total world exports has been about $41.8 million annually. It is worth noting that while Malaysia is the world leader in terms of quantities exported, Malaysia commands an average of only about 11% share of world exports in terms of reported value.
Cocoa butter
Cocoa butter is the fat obtained from the seeds of Theobroma cacao L. (Fam. Sterculiaceae). In the USA, cocoa butter is classified by the FDA as a Generally Recognized as Safe and Effective (GRASE) active ingredient for human use in over-the-counter (OTC) drug products labeled as an anorectal protectant, lip protectant, and/or skin protectant drug. The top 5 exporters account for about 70% of total world exports. In the 5-year period 2001-2005, in terms of value, the 5 leading exporters were Netherlands (about 36%), France (12.4%), Malaysia (10%), Indonesia (6%), and Brazil (5.7%). In 2006, Malaysia exported 95,383,180 kg, mainly to the USA (25,540,460 kg), the Netherlands (20,570,993 kg), Japan (10,291,131 kg), and France (7,121,680 kg), among others.
The leading supplier of cocoa butter to the USA is Malaysia. In 2005, the USA imported a total of 96,876,082 kg, valued at $402,426,889, of which 26.4% of the supply came from Malaysia (25,591,376 kg valued at $98,741,019). In 2004, the USA imported a total of 94,890,013 kg, valued at $306,882,591, of which 32.9% of the supply came from Malaysia (31,233,109 kg valued at $91,414,467). Other major suppliers to the USA are Brazil, Indonesia, Côte d’Ivoire, and China.
The leading supplier of cocoa butter to the EU-25 Member States is Côte d’Ivoire, followed by Malaysia and Indonesia. In 2005, the EU-25 imported 151,552,650 kg, valued at $563,190,332, of which 16.3% came from Malaysia (24,629,728 kg valued at $91,527,432). In 2004, the EU-25 imported 123,165,113 kg, valued at $457,698,372, of which 10.9% came from Malaysia (13,463,673 valued at $50,032,847). Besides the top three suppliers of cocoa butter to the EU-25 (Côte d’Ivoire, Malaysia, and Indonesia), other important suppliers include Brazil, Ghana, Ecuador, Nigeria, Peru, Turkey, China, Thailand, and Mexico, among others.
Curry powder
An explanation is required first as to why curry powder was included in the scope of this study. While curry powder is not actually used as a natural ingredient in cosmetics, dietary supplements and/or pharmaceuticals, it is composed of a mixture of herbs and spices that are used in these finished product categories. Therefore, the inclusion of curry powder provides more information on the overall import and export of natural ingredients that have multiple end uses from foods, to supplements, to cosmetics and pharmaceuticals. Indeed, many of the other natural ingredients covered in this study are also used in the food sector.
Curry powders are quite regionally variable usually containing 10 or more botanicals including coriander fruit, cumin fruit, fennel fruit, capsicum fruit, turmeric rhizome, clove flower bud, cinnamon bark, cardamom seed, black pepper fruit, ginger rhizome, galangal rhizome, fenugreek seed, tamarind pulp, and star anise fruit, among others. The top 5 exporters account for over 60% of total world exports. In the 5-year period 2001-2005, in terms of value, the 5 leading exporters of curry powder were the UK (about 23%), France (about 13%), Malaysia (11%), Japan (8%), and India (7%). According to COMTRADE, in 2006, Malaysia exported 1,813,685 kg, mainly to Singapore (1,428,064 kg), as well as to Brunei Darussalam (110,679 kg), Australia (76,777 kg), and the USA (43,583 kg), among others. The amount exported to the USA, however, according to the U.S. Department of Commerce was somewhat higher than the quantity reported by COMTRADE at 50,443 kg rather than 43,583 kg.
The leading supplier of curry powder to the USA is Thailand, accounting for about 46% of the supply in 2006 and about 40% in 2005. According to the database of the U.S. Department of Commerce, Bureau of the Census, in 2005, total U.S. imports of curry powder for consumption were 1,723,994 kg, valued at $4,916,000, of which about 2.6% came from Malaysia (45,321 kg valued at $110,000). The highest volume suppliers of curry powder to the USA are consistently Thailand, India, and Pakistan.
The leading supplier of curry powder to the EU-25 Member States is India, accounting for about 44% of the reported value of EU imports. According to COMTRADE, in 2005, total EU-25 imports of curry powder were valued at $10,394,887, of which 0.76% came from Malaysia (valued at $79,811). The highest volume suppliers of curry powder to the EU-25 are India, Brazil, China, Thailand, Pakistan, and Sri Lanka.
It is interesting to note that in the seven year period of 2000 through 2006, Malaysia ranked as the #2 exporter of curry powder with a European re-exporter, the UK, in the #1 position, France #3, Japan #4, and India at #5. Even though Malaysia is the #2 exporter, in terms of volume, Malaysia has barely penetrated the major import markets of the EU-25 and the USA. In both markets, India, Thailand, and Pakistan are strong competitors for market share.
Black pepper fruit
Black pepper and white pepper are obtained from Piper nigrum L. (Fam. Piperaceae). Various forms (dried fruit, dried extracts, oils, oleoresins) of black pepper are used in cosmetics (ointments), dietary supplements (as a digestive aid), foods (as a flavoring and spice), and medicinal products (especially as a component of traditional Ayurvedic, Chinese, and Unani medicines, respectively, as well as dilutions used in the homoeopathic system of medicine). For the five-year period 2002 through 2006, in terms of value, the 5 top exporters of Piper genus fruits have accounted for over 60% of total world exports; Indonesia (19.3%), Brazil (16.8%), Malaysia (9.1%), Singapore (8.8%), India (6.5%).
In 2006, Malaysia exported 16,609,579 kg valued at $39,487,073, representing an 8.7% share of world exports for 2006. The main destinations for Malaysian Piper fruits were Japan, Singapore, South Korea, Other Asia NESOI, as well as lower amounts exported to the USA, Germany, and the UK, among others.
The leading suppliers of Piper fruit to the EU-25 Member States are Vietnam (41% of supply), Brazil (16.7%), Indonesia (15.7%), India (11.9%), Malaysia (5.7%), China (2.8%), and Singapore (1.5%). In 2005, the EU-25 imported 52,821,317 kg with a reported trade value of $109,819,870, of which 5.7% in terms of volume came from Malaysia (2,984,203 kg with a reported trade value of $5,941,659).
The leading suppliers of Piper fruit to the USA are Vietnam, Indonesia, Brazil, and India. In 2006, total USA imports of Piper fruits for consumption amounted to 70,538,895 kg, valued at $135,473,000, of which about 1% in terms of volume came from Malaysia (669,591 kg with a customs value of $2.71 million). The USA imported Piper fruit from Malaysia in three forms; HS 0904.1100.40: whole white pepper 418,632 kg, HS 0904.1100.20: whole black pepper 248,915 kg, and HS 0904.1200.00 crushed or ground pepper 2,044 kg.
Fruit of the Piper genus is an interesting example where Malaysia is ranked as the world’s the #3 exporter in terms of reported value with a 9.1% share of world exports. Malaysia’s share of EU-25 imports is 5.4% in terms of value and 5.7% in terms of volume. Malaysia’s share of USA imports is 2.0% in terms of value and 0.95% in terms of volume. Therefore it appears that there is an opportunity to increase imports to the EU-25 and USA to levels that are closer to Malaysia’s percentage share of world exports. Malaysia’s main competition for increased market share will mainly come from Vietnam and Indonesia.
Other spices
The category of “Other Spices NESOI” (HS 0910.99) includes many spices in their crushed, powdered or spent forms, whereas their whole or unprocessed forms are generally classified under a separate HS Code in Chapter 09. For example, while various varieties of whole cardamoms are classified under HS Codes 0908.3010 through 0908.3060, and powdered cardamoms are classified under HS 0908.3070, cardamom husk is captured under this “other spices” category with HS Code 0910.9931. In some cases, the whole form and the powdered form of a spice are classified under HS 0910.99. For example, fenugreek seed is HS 0910.9912 and powdered fenugreek seed is HS 0910.9924.
Other spices typically classified under HS 0910.99 (although not all of these are of relevance to Malaysia) include ajowan fruit (Trachyspermum ammi), basil seed, crushed (Ocimum basilicum), celery fruit (Apium graveolens), dill fruit (Anethum graveolens), Ethiopian pepper (Xylopia aethiopica), fenugreek seed (Trigonella foenum-graecum), Mexican oregano (Lippia graveolens), okra seed, crushed (Abelmoschus esculentus), poppy powder (Papaver somniferum), Sicilian sumac fruit (Rhus coriaria), sickle-pod senna seed (Cassia tora), spice husks (e.g. cardamom husk), and various crushed or powdered spices, spent spices, NESOI.
The top five exporters of “other spices” (HS 0910.99) account for about 60% of total exports in terms of value. During the six year period of 2000 through 2005, the top exporters were France (19.1%), India (18.3%), USA (9.2%), China (7.3%), and Austria (5.7%). In 2006, Malaysia exported 1,010,661 kg of “other spices” with a reported trade value of $1,519,646, in terms of value 38.9% less than the reported value for previous year 2005 exports which was 1,519,646 kg valued at $5,025,773. Malaysia’s percentage share of world exports in terms of reported value was 1.8% in 2005 and 2.2% in 2006. The main destinations for Malaysian “other spices” are Japan, Australia, New Zealand, Singapore, South Korea, and the UAE. Only very small amounts are exported to EU-25 Member States or the USA.
In 2005, the EU-25 Member States imported 7,644,395 kg of “other spices” traded under HS Code 0910.99 with a reported trade value of $28,186,125, of which only 0.1% came from Malaysia, both in terms of value and volume (7,705 kg with a trade value of $28,409). Nearly 70% of the raw material supply imported into the EU-25 comes from 5 countries, although it should be noted that Eastern European countries produce significant quantities that are traded “intra-EU” and therefore those quantities are not classified as imports into the EU-25. During the two year period of 2004 and 2005, in terms of value, 32.7% of the EU-25 supply was imported from Israel, 16.3% from Thailand, 13.2% from India, 6.7% from Brazil, and 5.8% from Turkey.
In 2006, the USA imported 14,739,904 kg of “other spices” (HS 0910.99) with a reported customs value of $45,304,856, of which only 0.2% in terms of quantity, or 0.5% in terms of value, came from Malaysia (33,092 kg valued at $219,1893). The U.S. Department of Commerce, Bureau of the Census, Foreign Trade Division, divides the total U.S. import quantity of other spices as follows: HS 0910.9920.00: Lippia spp., crude or not manufactured, 4,712,795 kg with customs value of $8,813,000; HS 0910.9940.00: Lippia spp. NESOI, 456,820 kg with customs value of $962,000; HS 0910.9950.00: dill fruit (Anethum graveolens), 816,860 kg with customs value of $1,576,000; and HS 0910.9960.00: Spices NESOI, 8,753,429 kg with customs value of $27,474,000. In terms of value, the main suppliers of these “other spices” to the USA are Israel (25%), Turkey (16.5%), Mexico (10.5%), India (8.7%), Columbia (8.1%), China (3.8%), Brazil (3.2%), Germany (2.8%), and Peru (2.3%), among others. In terms of volume, however, nearly 65% of the US supply is imported from only four countries; Turkey 24.4%, India 18.3%, Mexico 12.9%, and Israel 8.3%.
This “catch-all” category of “other spices” is another interesting example where, in terms of reported values, Malaysia owns about 2% share of total world exports but only 0.1% of the EU-25 imports come from Malaysia and about 0.5% of USA imports come from Malaysia. There appears to be an opportunity for Malaysia to increase its share in the EU-25 and the USA. Malaysia’s main competition for increased market share will mainly come from Israel, India, Thailand, and Turkey.
Gutta-percha
Gutta percha is the coagulated, dried, purified latex of the trees of the genera Palaquium and Payena and most commonly Palaquium gutta). The trade of gutta percha is classified under a general HS Code (HS 4001.30) that also includes many other natural gums including, among others, gutta hang kang (Palaquium leiocarpum and Palaquium oblongifolium), balata (Manilkara bidentata), chicle (Manilkara zapota), guayule (Parthenium argentatum), jelutong bukit or pontianak (Dyera costulata, Dyera lowii, or Dyera latifolia), leche caspi sorva (Couma macrocarpa), and other similar natural gums.
Gutta-percha is classified as a medical device, specifically a dental prosthetic material made from coagulated sap of certain tropical trees intended to fill the root canal of a tooth. The gutta percha is softened by heat and inserted into the root canal, where it hardens as it cools.(1)
Malaysia and Indonesia are major producers of gutta-percha. Small quantities are also produced in Thailand. The major markets for gutta-percha are Japan, EU, USA, South Korea, China, and Australia.(ii) The top 5 exporters account for over 60% of total world exports of HS 4001.3001 (which includes gutta-percha, among other similar gums). In the 5-year period 2001-2005, in terms of value, the 5 leading exporters of HS 4001.3001 were Singapore (18.5%), USA (11.8%), Sweden (11.0%), Mexico (10.2%), and Indonesia (9.3%). Malaysia’s share of world exports of HS 4001.30 is about 1.5%. In 2005, Malaysia exported 151,160 kg, mainly to Other Asia NESOI (96,000 kg) and Thailand (54,800 kg.).
In 2005, the EU-25 Member States imported an unreported quantity of HS 4001.30 with a reported trade value of $1,878,866, of which 5.6% of the value was attributed to Malaysia. The top five suppliers to the EU-25 in 2005 were Viet Nam (56.7%), Thailand (15.9%), South Korea (7.7%), Malaysia (5.6%), and Singapore (4.2%).
In 2006, the USA imported 95,622 kg HS 4001.30 with a reported trade value of $265,232, of which 0% was from Malaysia. The main suppliers to the USA in terms of volume were Singapore (55.3%), South Korea (19.5%), and Sri Lanka (16.9%). For the portion of HS 4001.30 that is gutta-percha alone, the main supplier to the USA is Thailand, followed by South Korea. The U.S. Department of Commerce, Bureau of the Census, breaks down the total 2006 quantities imported HS Code 4001.30 as follows:
HS 4001.3000.05: Balata 0 kg
HS 4001.3000.10: Gutta-Percha and Guttas NESOI 1,424 kg
HS 4001.3000.15: Jelutong or Pontianak 0 kg
HS 4001.3000.20: Chicle 6,061 kg
HS 4001.3000.25: Leche Caspi and Sorva: 0 kg
HS 4001.3000.50: Guayule and Natural Gums NESOI 88,137 kg
While gutta-percha is not a high volume commodity, it is a high value natural ingredient. In 2005, Malaysia commanded 1.4% share of world exports but represented 5.6% of EU-25 Member States imports in terms of value. A review of USA trade data from recent years shows that Malaysia has not yet penetrated this market. In order to enter the USA market and/or to increase share in the EU-25, Malaysia will face competition mainly from Viet Nam, Thailand, and South Korea.
Tea extracts
HS Code 2101.20 includes various bulk extracts, essences and concentrates of tea leaf (Camellia sinensis), tea leaf with jasmine flower (Jasminum officinale) and/or maté leaf (Ilex paraguariensis) including instant teas, jasmine tea extracts, maté concentrates, essences, extracts, and preparations, oolong tea extracts, tea leaf concentrates, essences, extracts and preparations, and tea preparations consisting of tea mixed with milk powder and sugar.
This category is one of Malaysia’s top natural ingredient exports and in terms of value Malaysia had a 2.0% share of world exports in 2004 and 1.2% share in 2005. The world’s top 5 exporters of HS 210120 account for 46.4% of trade value. In the 5 year period of 2001 through 2005 the top exporters were Canada (14.9%), USA (11.6%), Ireland (7.3%), Switzerland (6.4%), and Mexico (6.3%). In 2006, Malaysia exported 152,339 kg with a reported value of $1,144,332, with main destinations of Kenya, the UK, China, Singapore, Germany, the Netherlands, Thailand, India and Indonesia.
In 2005, the EU-25 Member States imported 11,526,004 kg with a reported value of $71,864,562, of which only 0.018% in terms of value came from Malaysia (2,038 kg valued at $12,708). In 2005, the main suppliers of tea extracts to the EU-25 were Switzerland (40.9%), Croatia (10.1%), Sri Lanka (9.5%), India (7.6%), Chile (6.9%), Costa Rica (5.1%), the USA (4.4%), Kenya (3.7%), Romania (3.4%), China (2.2%), Belarus (2.1%) and the Russian Federation (1.8%).
In 2006, the USA imported 76,926,109 kg with a reported trade value of $118,990,826, of which only 0.018% in terms of value came from Malaysia (8,588 kg valued at $21,735). In 2006, the main suppliers of tea extracts to the USA were Canada (47.1%), Mexico (12.1%), India (11.2%), China (10.0%), Kenya (5.6%), Japan (4.7%), Chile (4.0%), and Singapore (2.4%), among others. The U.S. Department of Commerce, Bureau of the Census, breaks down the 2006 U.S. imports of tea extracts as follows:
- HS 2101.2020.00 Tea and/or maté extracts, essences and concentrates: 5,009,048 kg (mostly from India, Kenya, Chile, and China)
- HS 2101.2032.00 Preparations with basis of tea or maté, their extracts, essences and concentrates: 699 kg (all from Taiwan)
- HS 2101.2048.00 Preparations with a basis of tea or maté or their extracts, essences or concentrates, containing GT 65% sugar, NESOI: 352,650 kg (mostly from Japan)
- HS 2101.2054.00 Preparations with a basis of tea or maté or their extracts, essences or concentrates, containing GT 10% sugar: 49,036,960 kg (mostly from Canada; 800 kg from Malaysia)
- HS 2101.2058.00 Preparations with a basis of tea or maté or their extracts, essences or concentrates, containing GT 10% sugar, NESOI: 21,980,237 kg (mostly from Mexico; 5,904 kg from Malaysia)
- HS 2101.2090.00 Other preparations with a basis of tea or maté or their extracts, essences or concentrates, NESOI: 2,622,104 kg (mostly from Canada, Singapore and Thailand; 1,884 kg from Malaysia).
While Malaysia has a good percentage share of world exports of tea extracts (2.0% in 2004 and 1.2% in 2005), and while, in terms of value, tea extracts are among Malaysia’s top natural ingredients for export, Malaysia has not yet penetrated either the EU-25 or USA markets, respectively. Coincidentally, the percentage share of Malaysian tea extracts imported into the EU-25 and the USA is 0.018% in both cases. It appears that there may be an opportunity for Malaysia to increase market share of tea extracts to both markets but in both cases, most of the imports are coming from neighboring countries. Malaysia’s main competition for the EU-25 market will be neighboring European countries of the EU-25 such as Switzerland and Croatia and main competition for the USA market will be from North American countries neighboring the USA, Canada and Mexico. Malaysia’s main Asian competitors for these markets are India, Sri Lanka, China, Japan, Singapore and Thailand.
Other interesting Malaysian exports
Capsicum and Pimenta fruits: Various forms of capsicum fruit are used in dietary supplements, foods, and pharmaceuticals. For example, Capsicum oleoresin, the alcoholic extract of the dried ripe fruits of Capsicum annum var. minimum and small fruited varieties of C. frutescens, is a Generally Recognized as Safe and Effective (GRASE) active ingredient for over-the-counter (OTC) drug use in humans as a counterirritant, external analgesic, and/or topical analgesic. Although Malaysia’s exports are mainly in the form of the dried, crushed or ground fruits, it is worth noting that a potential for value-adding exists in order to export the oleoresin form for the pharmaceutical markets. The USA, in 2006, imported 557,198 kg of capsicum oleoresin (HS 3301.9010.10), mainly from India. Malaysia’s percentage share of world exports for dried Capsicum genus and/or Pimenta genus fruits in 2004 was 1.36% and 1.08% in 2005. For the natural ingredients analyzed in this study, this category ranks as Malaysia’s #4 export in terms of value and is showing steady growth (7.2% growth in 2006 compared to 2005). For the five year period of 2001 through 2005, the top exporters in terms of value were China (23.6%), India (15.5%), Spain (12.0%), Peru (8.9%), and Chile (4.3%).
Carrageenan: The general classification HS 130239 includes various mucilages and thickeners NESOI, including carrageenan, which is the hydrocolloid obtained by extraction with water or aqueous alkali from the following members of the families Gigartinaceae and Solieriaceae of the class Rodophyceae (red seaweed): Chondrus crispus, Chondrus ocellatus, Eucheuma cottonii, Eucheuma spinosum, Gigartina acicularis, Gigartina pistillata, Gigartina radula, and Gigartina stellata. The top 5 exporters of HS 130239 are Denmark, the USA, France, the Philippines, and Germany. The precise volume of carrageenan exported from Malaysia is not clear due to the general HS Code classification that includes other mucilage. In 2006, Malaysia exported 432,633 kg of HS 130239, mainly to Spain, and also 27,832 kg of HS 130232 (includes mucilage from locust bean [Ceratonia siliqua], a.k.a. carob bean gum) mainly to China, Indonesia, and Singapore. In 2006, the USA imported 1,250 kg of carrageenan (HS 1302.390010) from Malaysia, which represented 83% of Malaysia’s exports to the USA under HS Code 130239. Therefore, it may be reasonable to assume that the majority of Malaysia’s exports of 6-digit HS 130239 are comprised of carrageenan. In 2006, the USA imported 10,050,337 kg of carrageenan (Customs Value: $61,985,000 USD) mainly from the Philippines (5,090,314 kg), Canada (1,781,981 kg), France (804,951 kg), Chile (744,300 kg), and Indonesia (503,900 kg).
Coconut oil: Malaysia exports a significant amount of coconut oil, which is used across all product categories; as a component of cosmetics, dietary supplements, foods, and pharmaceuticals. Even though Malaysia is a net importer of coconut oil, in 2004 Malaysia’s percentage share of world exports, in terms of value, was 9.01% and in 2005 was 8.44%. Also in terms of trade value, for the three year period of 2004 through 2006, Malaysia ranked #3 in exports commanding a 10.7% share of world exports. The Philippines was #1, Indonesia #2, the Netherlands #4, and Germany #5. The main destinations for Malaysian coconut oil are Singapore, the USA, Russian Federation, Ukraine, Australia, Italy, Iran, China, New Zealand, Indonesia, Syria, Argentina, Romania, Pakistan and the UK.
Mangosteen and Noni fruits: Specific trade data is not yet available on the exports of mangosteen fruit (Garcinia mangostana) and/or noni fruit (Morinda citrifolia), or extracts or juices thereof. Various forms of both fruits (e.g. dried or fresh fruit, fruit juices, fruit juice concentrates, dried powdered extracts or spray dried juice concentrates for use in capsules or tablets, etc…) are of significantly increasing demand in both Europe and North America and are used as components of cosmetics, dietary supplements and food products. Thailand, Malaysia, India and Indonesia all have the potential to be the market leaders in the supply of the botanical raw materials, as well as the value-added extracted or juiced forms and finished products for export.
Seaweeds and other algae: This general classification (6-digit HS Code 121220) includes, among others, black moss (Nostoc flagelliforme), Chinese green alga (Caulerpa taxifolia), hijiki (Hizikia fusiforme), kelp (Laminaria spp.), laver or nori (Porphyra spp.), sargassum (Sargassum pallidum or Sargassum fusiforme), sea tangle (Laminaria japonica or Echlonia kurome), and wakame (Undaria pinnatifida). Malaysia is a net exporter of seaweeds and in 2004 had a 0.89% share of world exports and in 2005 a 0.82% share. Of the natural ingredients analyzed in this study, seaweeds and other algae ranked as #8 in 2006 for Malaysia in terms of reported export values. The main destination for Malaysian seaweeds and other algae are “Other Asia NESOI,” Indonesia, China, Philippines, Cambodia, and Japan. The world’s top five exporters, however, command an over 72% share. For the five year period of 2001 through 2005, the top exporters were China (26.3%), South Korea (23.1%), Philippines (9.3%), Chile (7.5%), and Indonesia (6.0%). In 2006, the USA imported 30,055,899 kg of “seaweeds and other algae” with a reported customs value of $64,286,000, mainly from Canada, Indonesia, Philippines, Tanzania, Chile, China, South Korea, Iceland, and Madagascar. The USA has not imported “seaweeds and other algae” from Malaysia, so there appears to be an opportunity for the future.
Other medicinal plants and plant parts used in pharmacy and perfumery NESOI: Surprisingly, this category (6-digit HS Code 121190) is relatively small for Malaysia although it has great potential given the incredible biodiversity and range of unique medicinal plants available. Malaysia is a net importer of HS 121190, but Malaysia has a steadily growing percentage share of world exports, albeit still relatively low. In 2004, Malaysia’s percentage share of world exports was 0.14% and in 2005 it was 0.16%, but with significant growth; in terms of reported value, 25.3% growth in 2006 compared with 2005. In 2005, according to COMTRADE, Malaysia exported 626,125 kg of HS 121190, of which, according to the CITES database, 38.3% (239,781 kg) was agarwood, a.k.a. gaharu wood chips and powder (Aquilaria malaccensis). CITES has set the 2007 export quota for Malaysian agarwood at 200,000 kg.(iii)
In addition to Malaysia’s agarwood exports under HS 121190, this general category includes many other interesting medicinal plants that Malaysia could certainly develop for the export market including, among many others, andrographis herb (Andrographis paniculata), bitter melon fruit, leaf, and seed (Momordica charantia), calamus rhizome (Acorus calamus), cubeb fruit (Piper cubeba), greater galangal (Alpinia galangal), kaempferia galangal rhizome (Kaempferia galangal), lesser galangal (Alpinia officinarum), light galangal (Alpinia speciosa), garcinia fruit (Garcinia cambogia), gotu kola herb (Centella asiatica), Java tea (Orthosiphon aristatus), phyllanthus root, stem and leaf (Phyllanthus niruri), rauwolfia root (Rauvolfia serpentina), Ringworm senna leaf & seed (Cassia alata), tongkat ali root (Eurycoma longifolia), and west Indian lemongrass leaf (Cymbopogon citratus). Indeed, this is a category a natural ingredients that Malaysia appears to be focused on for future development. For example, the main objective of Malaysia’s “Herbal Valley” project is the large-scale cultivation of several medicinal plants that are traded under HS 121190 including andrographis, gotu kola, hibiscus (a.k.a. roselle), Java tea, and West Indian lemongrass. The top five exporters of HS 121190 account for over 50% share of world exports as determined by reported trade value. For the 5 year period of 2001 to 2005, the top exporters were China (21.6%), Germany (8.1%), India (8.1%), Hong Kong SAR of PRC (7.3%) and the USA (6.0%).
- Food and Drug Administration (FDA). 21 CFR, Ch I, Part 872 Dental Devices: Subpart D Prosthetic Devices: §872.3850 Gutta Percha. In: Code of Federal Regulations. Washington, DC: National Archives and Records Administration. 1 April 2006;342.
- Iqbal M. Trade restrictions affecting international trade in non-wood forest products. Rome, Italy: Food and Agriculture Organization of the United Nations. 1995. Available at: http://www.fao.org/docrep/V9631E/V9631E00.htm
- Convention on International Trade of Endangered Flora and Fauna. CITES list of national export quotas for 2007. Geneva, Switzerland: CITES: 25 May 2007. Available at: http://www.cites.org/common/quotas/2007/ExportQuotas2007.pdf