3.6.15 Mixtures of other Spices – Price Values and Quantity by Year from 2000 to 2007
3.6.15.1 Overview
| Common name: | Spies |
| Plant part used: | Seeds, fruits, stems,leaves, roots,etc |
| HS Code: | 091091000 |
| SITC Code: | 075298000 |
3.6.15.2 Analysis
Widely-recognised blends of mixtures of other spices can be found in,for examlple in curry powder and chat masala . These mixtures are cambinations of a number of herbal ingredients namely, dried red chilli, coriander seeds, mustard seeds, ground ginger and ground tumeric to name a few. The popular mixtures evolved, based on personal tastes. The amounts traded were relatively high and differed from year to year. During the period between year 2000 to 2007,the export quantities showed a generally increasing trend. The quantities had a range from 1268 kg to 115,035 kg. At the beginning of the period up to the year 2003, the quantities remained low and increased significantly thereafter. Large demands for the mixtures contributed to the increase in export. The revenues obtained from the export followed the same pattern as that of the quantities exported ,although the unit cost per kg of product indicated irregular values. These costs were unpredictable and did not correspond to the supply and demand pattern of the quantities exported.
The differences in export over import costs per kg of product during the period generally showed positive values, implying that profits were made in the transaction. However in year 2004, the value was in the negative indicating that the exporters had to meet their commitment to supply to clients .

Table 91: Summary of export volumes and values
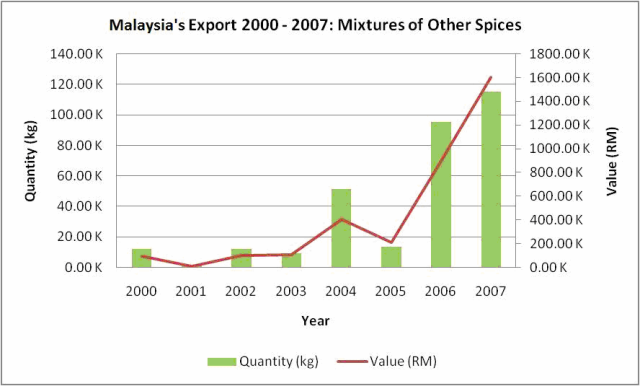
Figure 141: Malaysia’s export 2000 – 2007 for Mixtures of other Spices
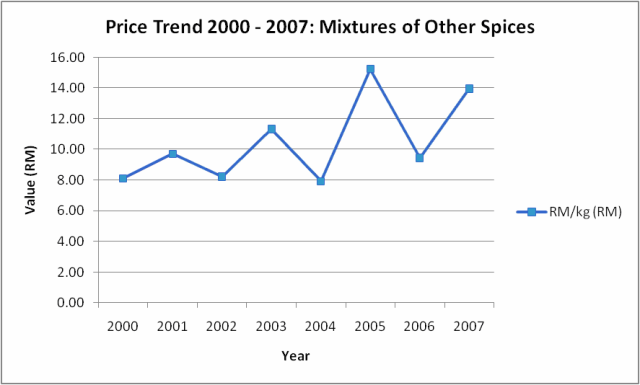
Figure 142: Exported Mixtures of other Spices price trend 2000 – 2007
| Year | Export (RM) | Import (RM) | Diff (RM) |
| 2000 | 8.11 | 6.39 | 1.72 |
| 2001 | 9.71 | 7.52 | 2.19 |
| 2002 | 8.24 | 7.85 | 0.39 |
| 2003 | 11.32 | 5.11 | 6.21 |
| 2004 | 7.94 | 13.78 | -5.84 |
| 2005 | 15.22 | 7.73 | 7.49 |
| 2006 | 9.45 | 4.69 | 4.76 |
| 2007 | 13.95 | 8.64 | 5.31 |
Table 92: Export and Import Unit Cost Differences of Herbal Products : 2000 -2007