3.6.21 Other Plants and Parts Of Plants Used Primarily in Perfumery, Pharmacy Or for Insecticidal/Fungicidal Use, W/N Cut/Crushed/Powder – Price Values and Quantity by Year from 2000 to 2007
3.6.21.1 Overview
| Scientific name: | N/A |
| Plant part used: | For perfumery, pharmacy,insecticide,fungicide |
| HS Code: | 121190900 |
| SITC Code: | 292490900 |
3.6.21.2 Analysis
The plants and other parts of the plants are traded in whole or crushed or in powder form. The quantities exported indicated an irregular profile with higher amounts in the early years and decreased progressively until year 2005, and picked up again until year 2007. The reason for this could be attributed to the increased in price per kg of product. The unit prices ranged from RM8.54 to RM27.02 during the period. The lowest quantity exported was in year 2005 during which the unit price per kg of product was at its peak. The quantities exported were in large amounts and the revenues earned during this period were very high from about RM3.204 million to about RM6.736 million. Its profile is also irregular and followed similar pattern as that of the quantities exported.
Looking at the differences between the export and import cost per kg of the product indicated that there were variations in the transactions. Negative values were observed during the first 3 years (from year 2000 to 2002) after which the differences became positive. Negative values indicated that the goods might have been cheaper internationally whilst positive. Values, is more in the traders’ favour.
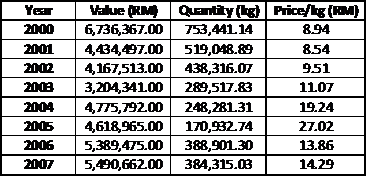
Table 103: Summary of export volumes and values
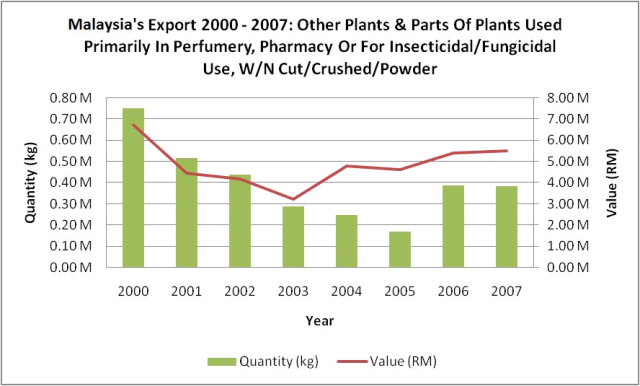
Figure 153: Malaysia’s export 2000 – 2007 for Other Plants & Parts Of Plants Used For Perfumery, Pharmacy, Insecticide, Fungicide
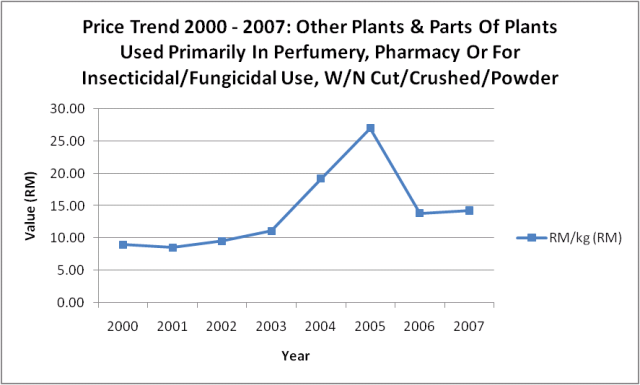
Figure 154: Exported Other Plants & Parts of Plants Used for Perfumery, Pharmacy, Insecticide, Fungicide price trend 2000 – 2007
| Year | Export(RM) | Import(RM) | Diff(RM) |
| 2000 | 8.94 | 9.11 | -0.17 |
| 2001 | 8.54 | 8.73 | -0.19 |
| 2002 | 9.51 | 10.90 | -1.39 |
| 2003 | 11.07 | 10.55 | 0.52 |
| 2004 | 19.24 | 11.88 | 7.36 |
| 2005 | 27.02 | 10.93 | 16.09 |
| 2006 | 13.96 | 11.97 | 1.89 |
| 2007 | 14.29 | 13.82 | 0.47 |
Table 104: Export and Import Unit Cost Differences of Herbal Products : 2000 -2007